To solve this, a stand-alone solution was developed, running on internal VMware servers, which provided a unified portal for executive management to view system statuses. The solution incorporated intuitive charts, infographics, and tables, organized into logical buckets and tabs, to enhance the user experience. The technical implementation involved using Angular for the front-end, C# for the back-end, and API integrations with over 10 different systems for data consolidation.


Custom reporting web-based application (SHIP). Reporting and infographics for executive management
Highlights
Chiron became a trusted vendor for VMware, providing services for over two years across multiple projects.
One notable project was the SHIP project, which aimed to provide executive management with a dedicated portal to review the status of incident systems deployed within VMware. The portal featured interactive charts and infographics, allowing users to easily visualize the status of different systems and track open tickets.

-
10+
Separate systems consolidated into a single portal, saving executives the hassle of logging into each system separately
-
50%
Achieved reduction in time spent on accessing and reviewing system statuses by providing a unified space for executives to view the status of all incident systems.
-
$1.2M
Saved on 3rd party apps maintenance by developing and utilizing internal solution tailored towards management needs
-
About The Project
The SHIP project addressed the challenge of logging into multiple systems separately to review the status of incident systems within VMware.
-
Problem
The executive management at VMware faced the challenge of having to log in to multiple systems separately in order to review the status of incident systems deployed within the organization.
This process was time-consuming and inefficient, as each system had its own interface and reporting format. There was a need for a centralized solution that would provide a clear and unified view of the system statuses, allowing for easier and more streamlined monitoring and reporting.
-
Solution
The portal featured charts and infographics that displayed the status of different systems and open tickets.
The solution to the problem was the development of the SHIP project, a dedicated portal that provided executive management at VMware with a centralized view of the status of all incident systems. The project aimed to consolidate the information from multiple systems into a unified space, providing a clear and consistent view of the system statuses. This streamlined the monitoring process and allowed for easier reporting and analysis.
-
Technical Implementation
Overall, the technical implementation of the SHIP project combined front-end and back-end technologies, API integrations, authentication mechanisms, and responsive design to deliver a powerful and user-friendly portal for executive management to monitor the status of incident systems within VMware.
- Front-end development: Angular framework was used to build the user interface of the SHIP portal.
- Back-end development: The back-end of the project was implemented using C# programming language.
- API integrations: Multiple systems were integrated with the SHIP portal using APIs to retrieve and display relevant data.
- Authentication module: An internal authentication module was implemented to allow users access to the portal and enable single sign-on functionality.
- Responsive design: The user interface was designed to be responsive, ensuring optimal display and usability across different devices and screen sizes.
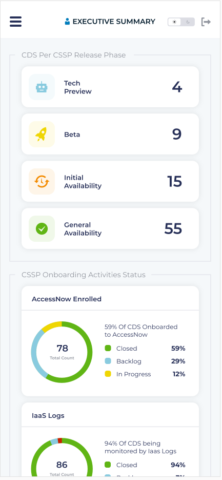
Project Snapshots
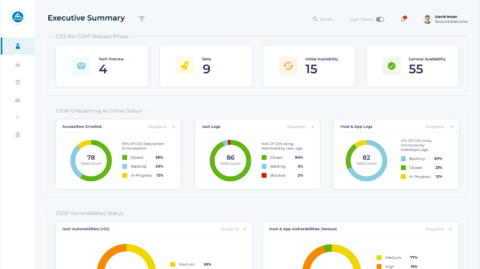
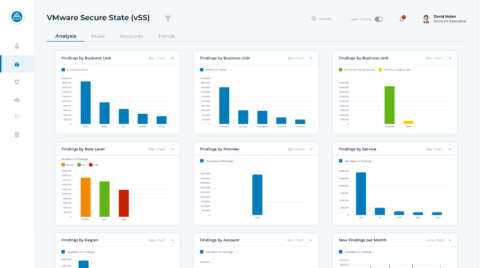
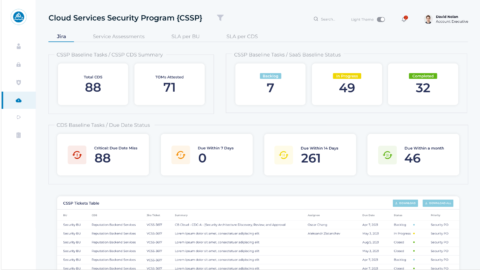
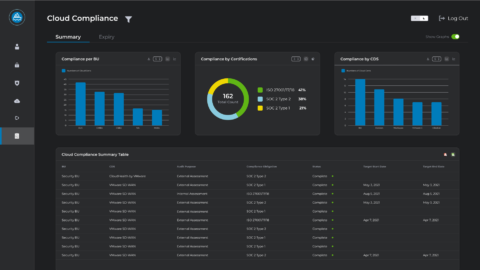
Below you can find examples of the application that was developed, charts and overall user interface
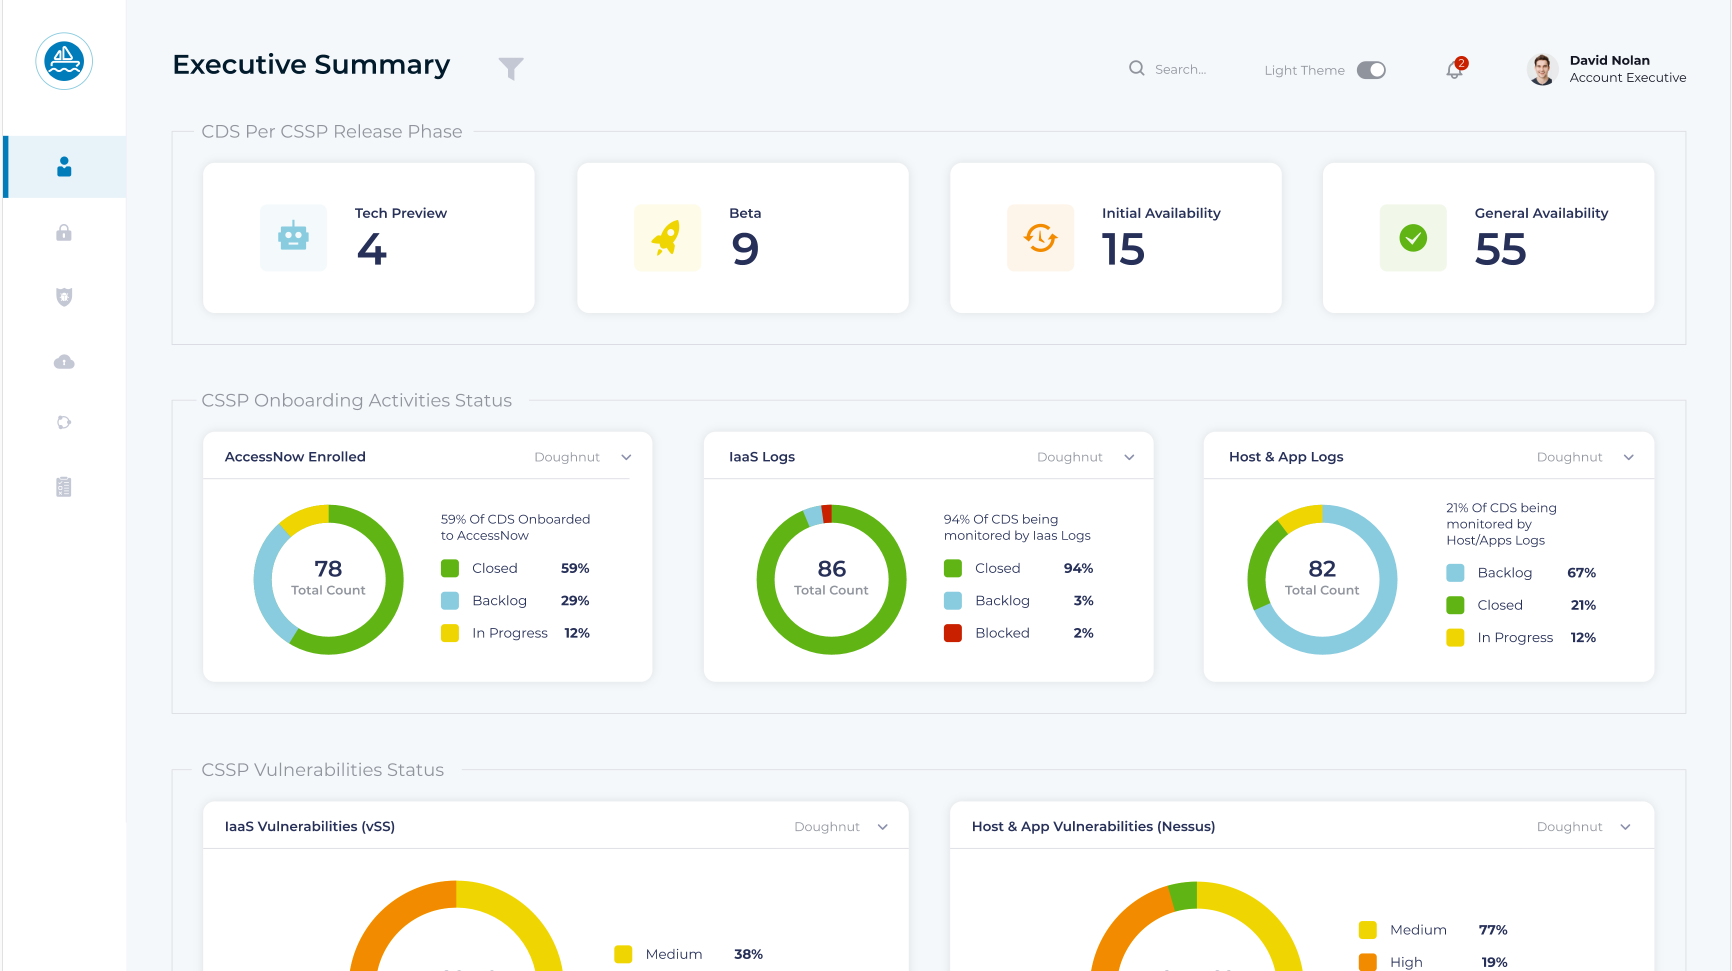
Executive Summary main page
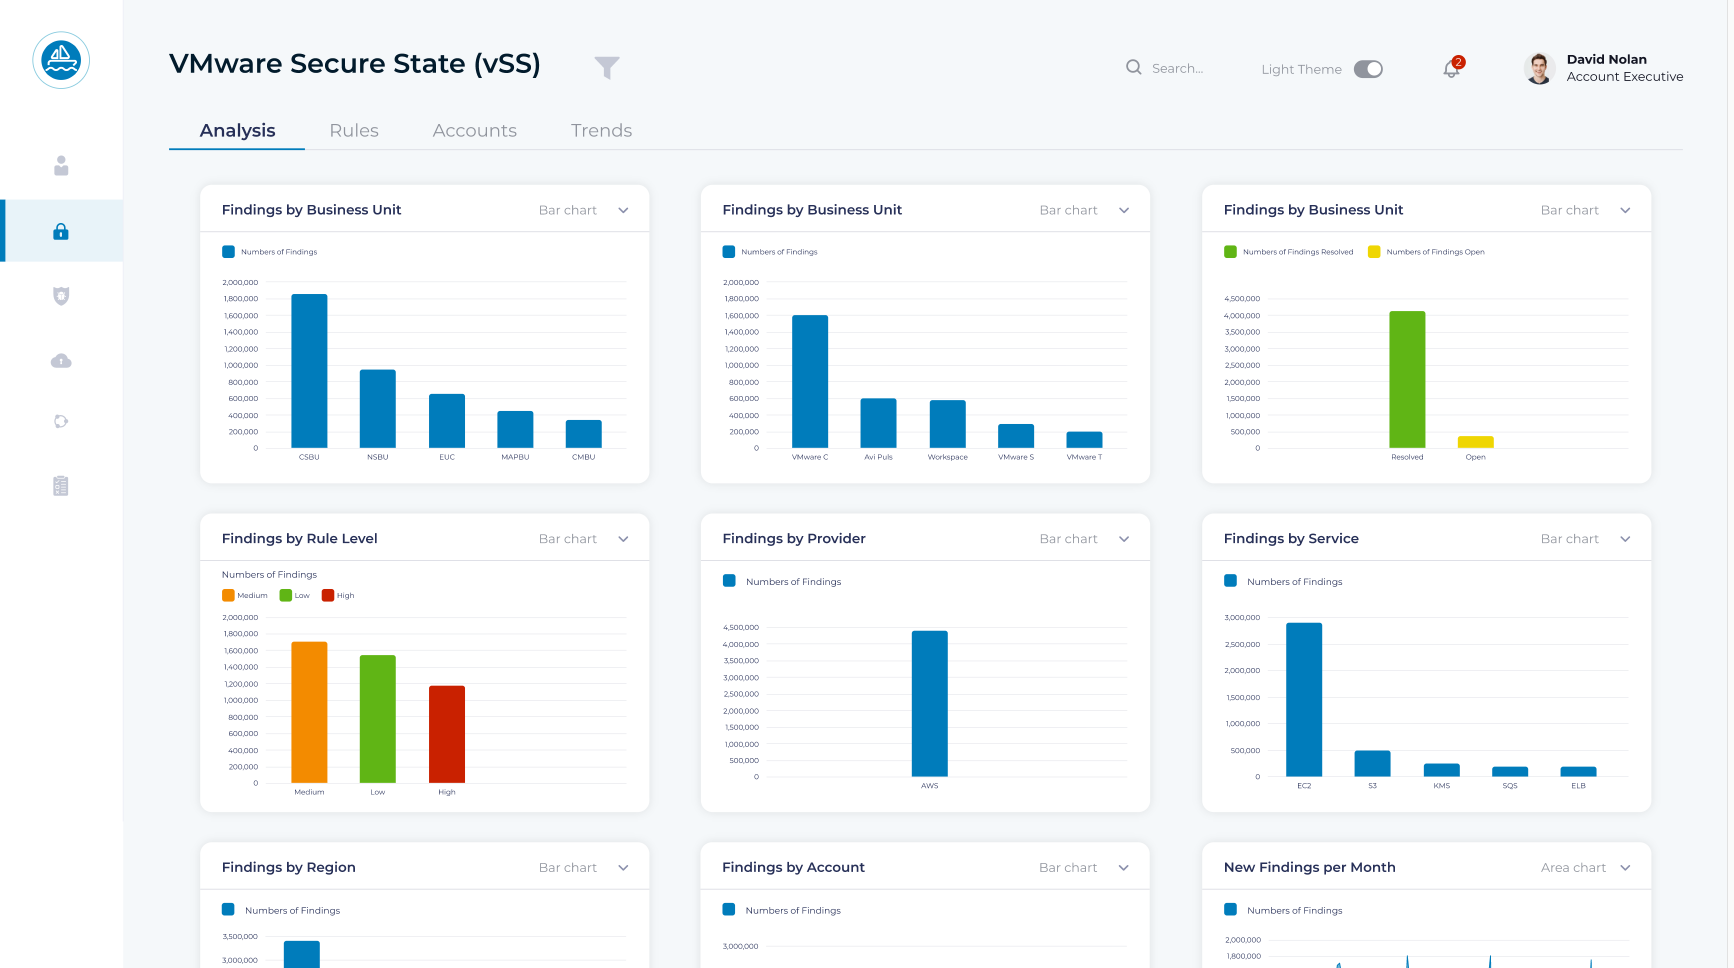
Secure State page with bar charts
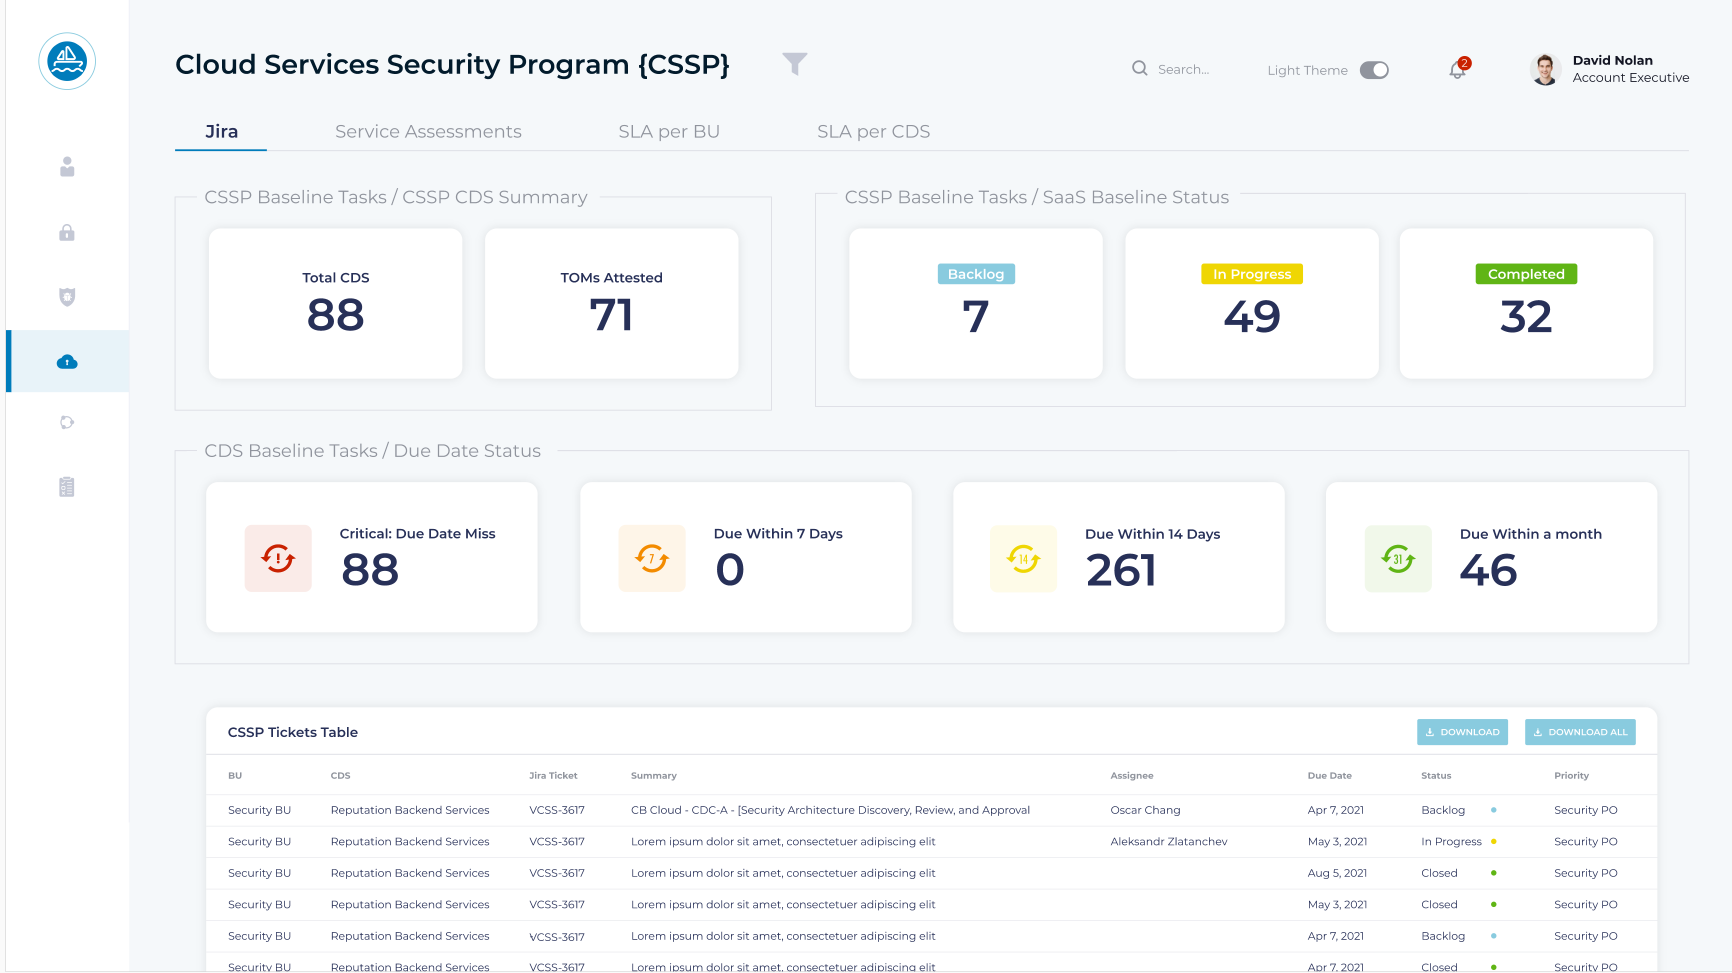
Cloud Services Security Program page
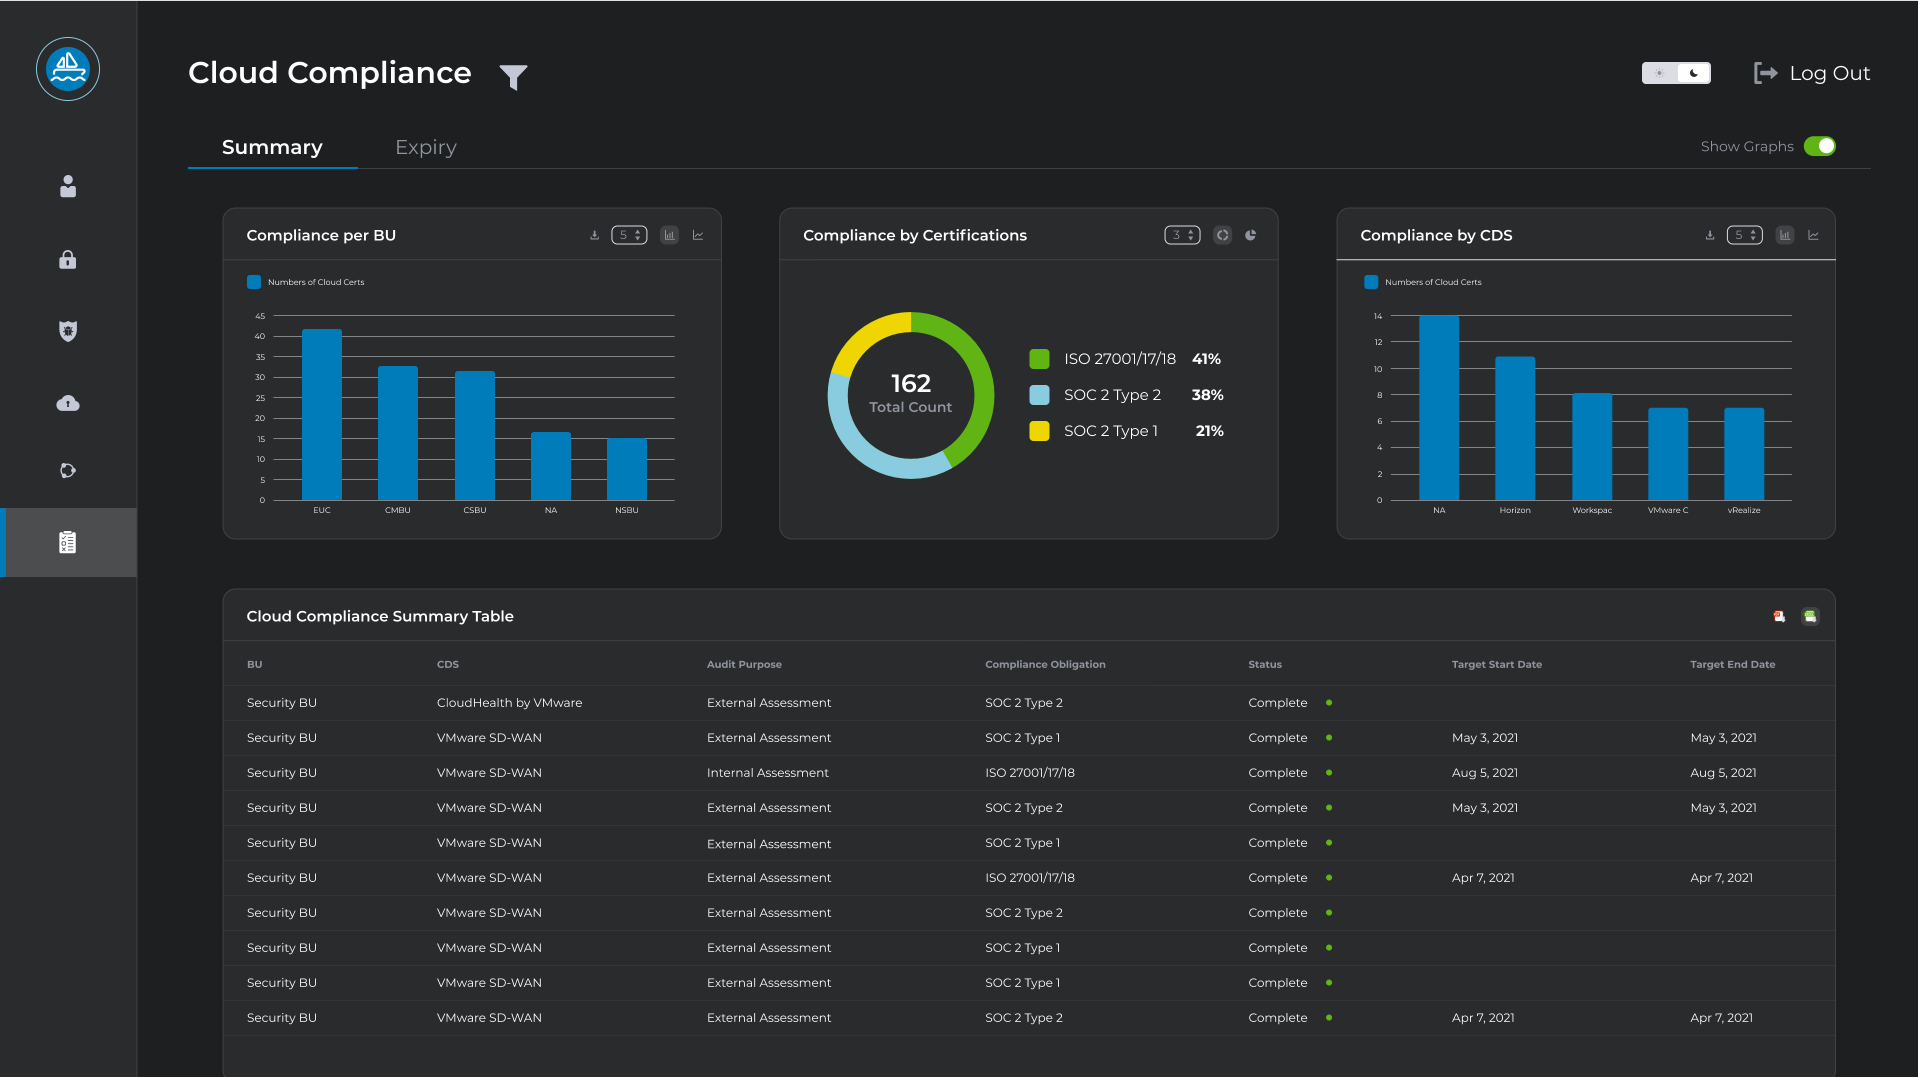
Dark Theme for the portal

Mobile view of the portal
Similar Case Studies
-
NIH – NCATS | 05 of August 2019

NIH – NCATS
REVIEW PROJECTWe delivered custom-built solutions to the NCATS and NIAID institutes, enabling scientists to enhance their activities and make impactful contributions.
-
EY | 14 of December 2020
EY
REVIEW PROJECTModern Meeting Experience solution for the global EY office with cloud apps integration
-
CVS | 23 of May 2023


